The State of America’s Sleep study found that young women are among the worst sleepers in America.
Methodology
2,000 surveys were fielded between April 10-18, 2019, among a representative sample of U.S. adults (age 18+), using a questionnaire lasting approximately 15 minutes. Sample size provides a confidence interval of ±2.19% at 95%. The sample was provided by Dynata, one of the largest online sample providers in the country.
Respondent Profile
| Gender | % |
| Male | 49% |
| Female | 51% |
| Age | % |
| 18-24 | 14% |
| 25-34 | 19% |
| 35-44 | 18% |
| 45-54 | 17% |
| 55+ | 32% |
| Generation | % |
| Gen Z (18-22) | 8% |
| Millennials (23-38) | 32% |
| Gen X (39-54) | 28% |
| Boomers (55-73) | 27% |
| Silents (74+) | 5% |
| Region | % |
| South | 37% |
| Midwest | 23% |
| Northeast | 21% |
| West | 19% |
Sleep Index
Analysis was conducted to establish a Sleep Index (SI) that can be used to track America’s sleep quality over time. The SI is calculated using the following questions:
Q2. On average, how would you describe your sleep within the past two weeks?
| Excellent | Very Good | Good | Fair | Poor |
| 5 | 4 | 3 | 2 | 1 |
Q7. Within the past two weeks, how often have you felt the following when you wake up in the morning?
| Tired (want to continue sleeping) | Rested/refreshed | |
| Frequently (10 to 14 times) | 1 | 5 |
| Often (6 to 9 times) | 2 | 4 |
| Occasionally (3 to 5 times) | 3 | 3 |
| Rarely (1 to 2 times) | 4 | 2 |
| Never | 5 | 1 |
The multiplicative index was scaled so the average score is 100. The index was used to create three groups, as depicted below, for analysis purposes.
| Poor Sleepers(SI<90) | Average Sleepers(SI>=90 and SI<=110) | Excellent Sleepers(SI>110) |
| 56% | 11% | 33% |
Worst Sleepers In America
Worst Sleeper Persona
(Personas are constructs based on worst sleeper data, reported in the next section)
There’s actually a tie for the worst sleeper in America.
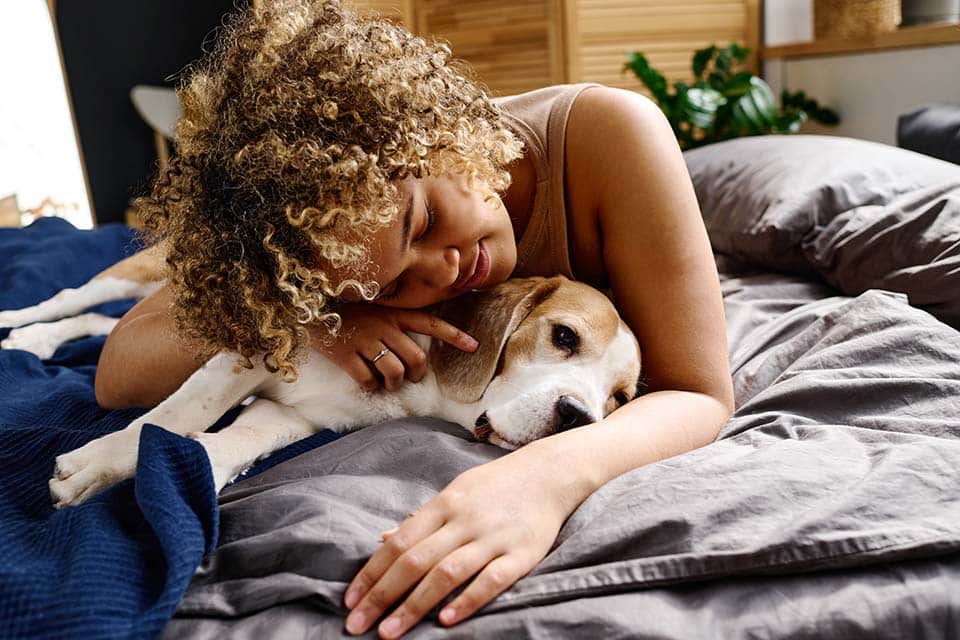
First, we have Jessica, a young mom in her early 30s. She is married and has two kids. In addition to being the primary caregiver/household manager in the family, she also works part time. With everything going on in her life, she almost never gets the recommended 7-8 hours sleep. And it often takes her more than 30 minutes to fall asleep even when she can get to bed at a reasonable hour. Jessica often finds herself waking up in the night, sometimes because of the kids, sometimes because of concerns about finances, work or her relationships. When that happens, she often has trouble getting back to sleep. Often the dog sleeps in her bed, and sometimes one of the kids crawls in bed with her as well. Needless to say, Jessica rarely feels rested when she gets up in the morning, and she often experiences aches and pains when she wakes up. She knows she needs to get more sleep, but she just can’t seem to make it happen.
Jessica’s life is fraught with stress. She and her husband tend to live paycheck to paycheck, although they do try to save a little – mostly toward their young children’s college education, for future expenses and for vacations. But it’s never enough. Jessica and her husband have a challenging relationship – due to the stresses of raising children, limited resources and living overscheduled lives. Jessica doesn’t make it easier on herself when it comes to sleep. To unwind she often has a couple of drinks in the evening. She often eats right before bed, checks social media and email, and starts working on the next day’s task list – she goes to bed with things on her mind and her stomach. She rarely exercises, usually only a couple of hours a week – she figures that her job and having to chase the kids gives her the exercise she needs.
Virtually tied with Jessica as America’s worst sleeper is Emma. She’s a college student on the West Coast, working part time and, like Jessica, living paycheck to paycheck. She has several roommates – who do the things college roommates do. Between school, work and her college activities, she’s often up late and up early – she hates early morning classes and rarely does well in them. Emma almost always feels tired, but she tends to shrug it off, telling herself she’s young and can handle it. Like Jessica, Emma is a late-night eater. Her bedtime routine usually includes checking her social media and catching up on her favorite shows on her tablet.
Emma hates her job. She doesn’t get along with her boss or her coworkers. The work isn’t at all fulfilling, but it does pay the bills and helps her set aside a little money each week for things she likes to splurge on. Between work and school and always feeling tired, Emma needs caffeine to keep her going. Sometimes she’s having coffee or cola well into the evening.
Worst Sleeper Data
Who are the Worst Sleepers in America?
- Women represent 57% of poor sleepers in America and 42% of excellent sleepers (Index 86)
- Younger generations
- Adult Gen Zs, 18 through 22, represent 10% of poor adult sleepers / 5% of excellent adult sleepers (Index 70)
- Millennials make up 34% of poor sleepers / 26% of excellent sleepers (Index 85)
- Students (18 years old and above) represent 7% of poor adult sleepers / 3% of excellent adult sleepers (Index 67). While students represent a small percentage of poor sleepers, they are twice as likely to be poor rather than excellent sleepers.
- 80% of women students (18 years old and above) are poor sleepers (vs. 53% men students)
- Adults with children under 18 at home make up 34% of poor sleepers / 22% of excellent sleepers (Index 83)
- 71% of women with children under 18 at home are poor sleepers vs. 56% men with children at home
- Pet owners represent 70% of poor sleepers / 61% of excellent sleepers (Index 92)
- People who feel stressed. Specifically, panelists who felt stressed often or very often in the two weeks preceding the research represented 50% of poor sleepers / 16% of excellent sleepers (Index 54)
- Financially stressed people. Adults who:
- Agree (somewhat or completely) that they are concerned about their own financial future represent 72% of poor sleepers / 55% of excellent sleepers (Index 85)
- Earn lower income are poor sleepers: Those with an income under $25K represent 22% of poor sleepers / 17% of excellent sleepers (Index 89). The average income for Poor sleepers = $65K / Excellent sleepers=$72K
- Agree (somewhat or completely) that they live paycheck to paycheck represent 56% of poor sleepers / 38% of excellent sleepers (Index 125)
- Disagree (somewhat or completely) that they usually save money so they can splurge a little make up 33% of poor sleepers / 21% of excellent sleepers (Index 81)
- Agree (somewhat or completely) that they generally have enough money to pay for only the necessities represent 52% of poor sleepers / 41% of excellent sleepers (Index 88)
- Disagree (somewhat or completely) that they regularly save money for unforeseen home expenses represent 40% of poor sleepers / 21% of excellent sleepers (Index 75)
- Disagree (somewhat or completely) that they save money to pay for their children’s college education make up 43% of poor sleepers / 27% of excellent sleepers (Index 63)
- Disagree (somewhat or completely) that they regularly save money, so they have enough for retirement make up 45% of poor sleepers / 25% of excellent sleepers (Index 73)
- Disagree (somewhat or completely) that they typically buy what they want when they want it make up 43% of poor sleepers / 31% of excellent sleepers (Index 83)
- Disagree (somewhat or completely) that they regularly save money for vacation represent 46% of poor sleepers / 28% of excellent sleepers (Index 82)
- Disagree (somewhat or completely) that they regularly save money for unforeseen medical expenses represent 48% of poor sleepers / 28% of excellent sleepers (Index 77)
- Adults with stressful work environment, specifically, those who:
- Agree (somewhat or completely) that they are under pressure at work represent 44% of poor sleepers / 30% of excellent sleepers (Index 78)
- Disagree (somewhat or completely) that they work in a friendly or respectful work environment, or that they enjoy their work or the people they work with, or that they feel valued at work represent 20% of poor sleepers / 10% of excellent sleepers (Index: 70)
- Adults in difficult relationships. People who agree (completely or somewhat) to having a difficult relationship with their spouse/partner represent 16% of poor sleepers / 9% of excellent sleepers (Index 81)
- People who do not like exercising. People who disagree (completely or somewhat) that they enjoy exercising represent 26% of poor sleepers / 21% of excellent sleepers (Index 91)
- People with physical pain.
- People who experience pain when sitting or standing represent 39% of poor sleepers / 19% of excellent sleepers (Index 68)
- People who experience pain when lying down represent 29% of poor sleepers / 9% excellent sleepers (Index 57)
- People experiencing psychological pain.
- People who were recently diagnosed with a medical condition (e.g., anxiety, depression, cancer) represent 25% of poor sleepers / 9% of excellent sleepers (Index 62)
- People who recently lost a loved one represent 15% of poor sleepers / 10% of excellent sleepers (Index 81)
Best Sleepers In America
Persona
(Personas are constructs based on best sleeper data, reported in the next section)
The best sleeper in America is Larry, a 70-something retiree. Larry and his wife are Empty Nesters, living in an upscale neighborhood in the suburbs in the Midwest. Larry almost always gets 7-8 hours of sleep and feels rested in the morning. He is relatively pain-free when he wakes up – especially for someone his age. Larry takes sleep very seriously. He rarely has a bedtime snack and avoids caffeine entirely. His bedtime routine includes reading – but no social media or email. Because of this Larry’s usually asleep almost as soon as his head hits the pillow, and he rarely wakes up in the night.
Larry feels his life is fulfilling. He’s got a great relationship with his wife and the two of them have several close friends. He has several interests and hobbies he enjoys, including attending plays and concerts. He watches news on TV and is concerned about terrorism and immigration. However, it doesn’t affect his sleep. He does some light exercising, but nothing too strenuous. In fact, nothing in Larry’s life is very strenuous. He lives a relatively stress-free life.
Best Sleeper Supporting Data
Who are the Best Sleepers in America?
- Men represent 43% of poor sleepers / 58% of excellent sleepers (Index 115)
- Older generations
- Boomers make up 22% of poor sleepers / 36% of excellent sleepers (Index 124)
- Silent Generation represents 3% of poor sleepers / 8% of excellent sleepers (Index 150). While the Silent Generation represents a small percentage of excellent sleepers, Silents are more than twice as likely to be excellent than poor sleepers.
- Retired adults make up 16% of poor sleepers / 28% of excellent sleepers (Index 132)
- People who do not feel stressed. Specifically, panelists who rarely or never felt stressed in the two weeks preceding the research represent 14% of poor sleepers / 47% of excellent sleepers (Index 164)
- Empty Nesters/people without children represent 66% of poor sleepers / 78% of excellent sleepers (Index 107)
- People who do not own a pet make up 30% of poor sleepers / 39% of excellent sleepers (Index 114)
- Adults with a bachelor’s degree or higher make up 35% of poor sleepers / 46% of excellent sleepers (Index 112)
- Financially comfortable people and those who plan ahead. Adults who:
- The average Income for Poor sleepers = $65K / Excellent sleepers=$72K
- Agree (somewhat or completely) that they regularly save money for unforeseen home expenses make up 42% of poor sleepers / 59% of excellent sleepers (Index 116)
- Agree (somewhat or completely) that they regularly save money, so they have enough for retirement represent 36% of poor sleepers / 52% of excellent sleepers (Index 118)
- Agree (somewhat or completely) that they typically buy what they want when they want it represent 36% of poor sleepers / 49% of excellent sleepers (Index 116)
- Agree (somewhat or completely) that they regularly save money for vacation represent 36% of poor sleepers / 50% of excellent sleepers (Index 114)
- Adults with positive experiences at work. People who:
- Agree (somewhat or completely) that they work in a friendly environment make up 74% of poor sleepers / 84% of excellent sleepers (Index 100)
- Agree (somewhat or completely) that they work in a respectful environment comprise 71% of poor sleepers / 81% of excellent sleepers (Index 101)
- Agree (somewhat or completely) that they enjoy the people they work with comprise 71% of poor sleepers / 81% of excellent sleepers (Index 103)
- Agree (somewhat or completely) that they feel valued at work represent 59% of poor sleepers / 75% of excellent sleepers (Index 106)
- Agree (somewhat or completely) that they enjoy the work they do a lot represent 65% of poor sleepers / 77% of excellent sleepers (Index 103)
- Adults in positive and meaningful relationships. People who:
- Agree (somewhat or completely) that they have a great relationship with their spouse/partner comprise 77% of poor sleepers / 88% of excellent sleepers (Index 110)
- Agree (somewhat or completely) that they have deep, meaningful friendships with people outside of their family make up 54% of poor sleepers / 61% of excellent sleepers (Index 107). While the Index is not quite 110, it is very different than the Index among adults who disagree (somewhat or completely) (Index 83).
- Agree (somewhat or completely) that they enjoy spending time with extended family make up 59% or poor sleepers / 67% of excellent sleepers (Index 105). While the Index is not quite 110, it is different than the Index among adults who disagree (somewhat or completely) (Index 81) and the difference in percentage between poor and excellent sleeper is statistically significant.
- Adults who enjoy exercising. People who agree (somewhat or completely) that they enjoy exercising make up 52% of poor sleepers / 60% of excellent sleepers (Index 106). While the Index is not quite 110, it is different than the Index among adults who disagree (somewhat or completely) (Index 91) and the difference in percentage between poor and excellent sleeper is statistically significant.
- Adults who enjoy staying up on the news. People who agree (strongly or somewhat) that they enjoy watching/listening/reading the news every day make up 50% of poor sleepers / 64% of excellent sleepers (Index 110)
- Adults who feel positively about current affairs and the state of the economy. Specifically, adults who:
- Agree (somewhat or strongly) that they feel good about the economy make up 30% of poor sleepers / 43% of excellent sleepers (Index 117)
- Agree (somewhat or strongly) that they believe that the country is headed in the right direction make up 26% of poor sleepers / 34% of excellent sleepers (Index 115)
- Agree (somewhat or strongly) that they are confident in the administration make up 25% of poor sleepers / 34% of excellent sleepers (Index 117)
- Agree (somewhat or strongly) that they have a high level of confidence in the stock market represent 18% of poor sleepers / 26% of excellent sleepers (Index 116)
Survey Details: Better Sleep Council May 2019